Analyze Differences Between Groups Using Paired and Independent Samples t-Test and ANOVA
Week 7 – Assignment: Analyze Differences Between Groups Using Paired and Independent Samples t-Test and ANOVA (15 Points)
Part I. Paired Samples t-Test
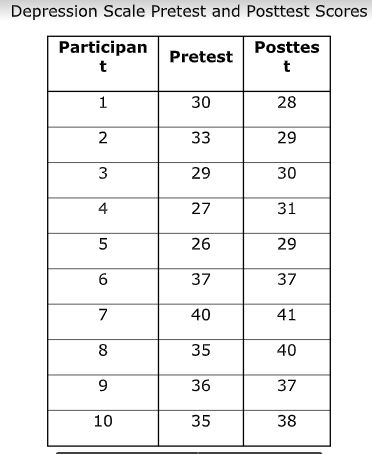
Please enter and analyze the data in the table below in SPSS with appropriate t-test analysis. These data contain changes in self-esteem scores from pretest (before psychological counseling) to posttest (after psychological counseling).
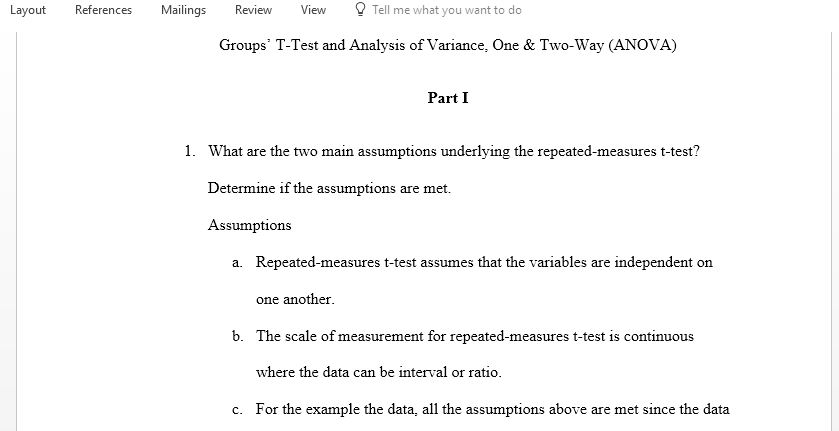
1. What are the two main assumptions underlying the repeated-measures t-test? Determine if the assumptions are met.
2. Please produce an SPSS output for the paired-samples t-test comparing the pre- and posttest scores.
3. Provide the null and alternative hypothesis.
4. What are the mean and standard deviation for beginning pretest and end posttest?
5. What is the value of the t statistic?
6. What is the mean difference?
7. What is the standard deviation difference?
8. What is the value of Cohen’s d? Is it small, medium, or large?
9. What might be concluded from these results? (Hint: The decision about the null hypothesis.)
Part II. Independent Samples t-Test
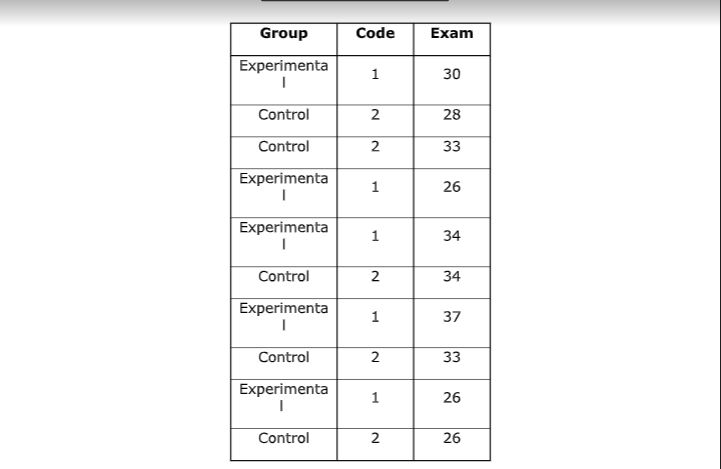
The experimental group received instruction in calculus via the Internet, while the control group received traditional classroom instruction. The data consist of the final examination scores for both groups. Conduct an independent-samples t-test, and then answer the questions that follow.
1. There are three main assumptions needing to be satisfied before using the independent-samples t-test for testing differences between the genders.
a. Use SPSS to generate the output needed to test the assumptions.
b. Please discuss each one and explain whether each assumption has been met using SPSS output as needed to include the Shapiro-Wilk test for normality (used when the sample size is
less than 50), histograms, and the Levene’s test.
c. Keep in mind if the population value is unknown, it is permissible to infer from sample values. Regardless of sample size, test whether these assumptions are met.
2. Please produce an SPSS output for an independent-samples t-test comparing the experimental and control group in the calculus exam score.
3. What are the null and alternative hypotheses?
4. What is the mean for the experimental group?
5. What is the mean for the control group?
6. What is the value of t?
7. What is the associated probability?
8. Report the results in APA format.
9. What might be concluded from this hypothetical study? (Hint: the decision about the null hypothesis)
Part III. Analysis of Variance
You will be entering and analyzing the data in the table below using SPSS. The data contain estimated hours of Internet usage for samples from three socioeconomic status (SES) groups. Name the first variable SES and label it “Socioeconomic Status.” Use the value labels of 3 = High SES, 2 = Middle SES, and 1 = Low SES. Name the dependent variable Internet and label it “Hours of Internet Usage (Weekly).”
1. Using SPSS, conduct a one-way ANOVA to test for differences in hours of Internet usage between the different SES groups. After conducting the ANOVA using SPSS, be sure to present the findings in the SPSS table format.
2. What is the mean for the low-SES group?
3. What is the mean for the middle-SES group?
4. What is the mean for the high-SES group?
5. What is the F-value?
6. What is the value of the associated probability?
7. Report the results in a narrative using APA format.
8. What can be concluded from these results? (Hint: The decision about the null hypothesis.)
Answer preview for Analyze Differences Between Groups Using Paired and Independent Samples t-Test and ANOVA
Access the full answer containing 940 words by clicking the below purchase button.


