Each coursework group will be allocated two real-life companies that are publicly traded on a U.S. stock market
Each coursework group will be allocated two real-life companies that are publicly traded on a U.S. stock market. The two companies A and B are Discovery and Netflix. The PERMNO and GVKEY numbers are important for the collection of data on WRDS.
1.1 Part 1
To complete this part, you will require data on your two companies’ monthly common-stock returns from January 2009 to December 2018.
Required tasks:
(a) Suppose you are advising an investor who is considering investing all his/her wealth in the stock of just one of the two companies allocated to your coursework group (Company A or Company B).
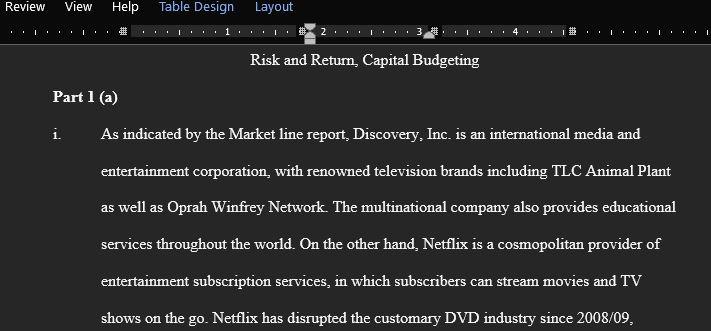
(i) Provide brief descriptions of Company A and of Company B.
(ii) Next, compare and contrast the stock return performance of the two companies’ common stocks over the calendar period using monthly return data from January 2009 to December 2018. Specifically, calculate the mean, variance and standard deviation of the monthly returns of the two stocks separately.
(iii) Briefly comment on your results and make a stock recommendation.
(b) Now suppose you are advising an investor who is considering investing all his/her wealth in a portfolio consisting of the two companies’ common stock held together.
(i) Calculate the mean, variance and standard deviation of the returns of portfolio comprising the two stocks with equal weights (i.e. 50:50). Next repeat the calculations for alternative portfolio weights, including 10:90, 20:80, 40:60, 60:40, 80:20, and 90:10. You may choose to construct additional portfolios (but remember the portfolio weights need to add to 100%). Report your results in a table. Compare and contrast your findings with those of the single-stock portfolios in part (a ii).
(ii) Illustrate your results in part (bi), along with the single-stock results in part (a ii), in a graph plotting the trade-off between the mean and standard deviation of the portfolio returns.
(iii) In the trade-off graph in part (ii), indicate the efficient frontier (assuming the stocks of Company A and B are the only available assets).
(iv) Finally, identify the minimum variance portfolio in the tradeoff graph. To do so, you can use trial and error, or the method outlined by Copeland, Weston and Shastri (Financial Theory and Corporate Policy, 4th International Edition, pp116-7; a copy of the relevant pages will be on the BMAN23000 Blackboard site). Report the portfolio weights of the minimum-variance portfolio, and the mean, variance and standard deviation of returns of the minimum-variance portfolio.
(v) Based on your findings in the previous parts, briefly explain to the investor how to choose his/her optimal portfolio assuming the two stocks are the only assets available to him/her. Also briefly indicate how your advice would change if other assets became available to the investor.
Answer preview for Each coursework group will be allocated two real-life companies that are publicly traded on a U.S. stock market
Access the full answer containing 950 words by clicking the below purchase button.

